
SKILLS

INTERACTIVE

GRAPHIC DESIGN

PHOTOGRAPHY


Crime is evident everywhere in the world. Even though crime is terrible and unwanted, it is a big part of our everyday lives. Most people are very aware of regular criminal activity such as gun violence, theft, harassment, and other crimes. However, many people are unaware of the criminal activity that happens through your computer, through your cellular device, and through any sort of electronic device. Cyber Crime is a large part of our everyday lives, we just don’t know it. That is why I created this infographic on Cyber Crime. I wanted to create an interactive and visual way to learn about a dismissed topic. The infographic is meant to portray facts about a somewhat lack-luster topic in an exciting way.

This project implemented many different components such as design, code, gsap animations, audio, svg usage, and more. A lot of these components were incorporated in this project to make it successful. The main point of creating this infographic was to showcase an important topic by animating and highlighting key elements to make everything work well together. This project was made with the plan to keep a fun and friendly feel, while getting the point across as well.

The objective of this project was to create an informative infographic that was creative and exciting. Often times infographics are thought of as “boring”. This project was meant to be a step away from that. Some of the challenges were to do with spacing and positioning in the designing phase, and other challenges occurred in JavaScript. In some of the infographic slides, it was difficult to line everything up proportionally to make the viewers eye move along the screen instead of going straight to one spot.
Ultimately this problem was solved with more time and a second set of eyes to help see a different side of the layout. I find it very helpful to get a second or even third opinion on designs, because often our creative minds can become “one-sided”. The other main problem was the animations, these were sometimes difficult to make. The way I wanted to have them in the beginning, sometimes turned out to be too big of a stretch. Not everything turns out the way it was meant to be in the beginning stages. These issues were solved with small changes and tweaks to the original plans. Problem solving is a key skill to have as a designer and I know that this project improved my skills.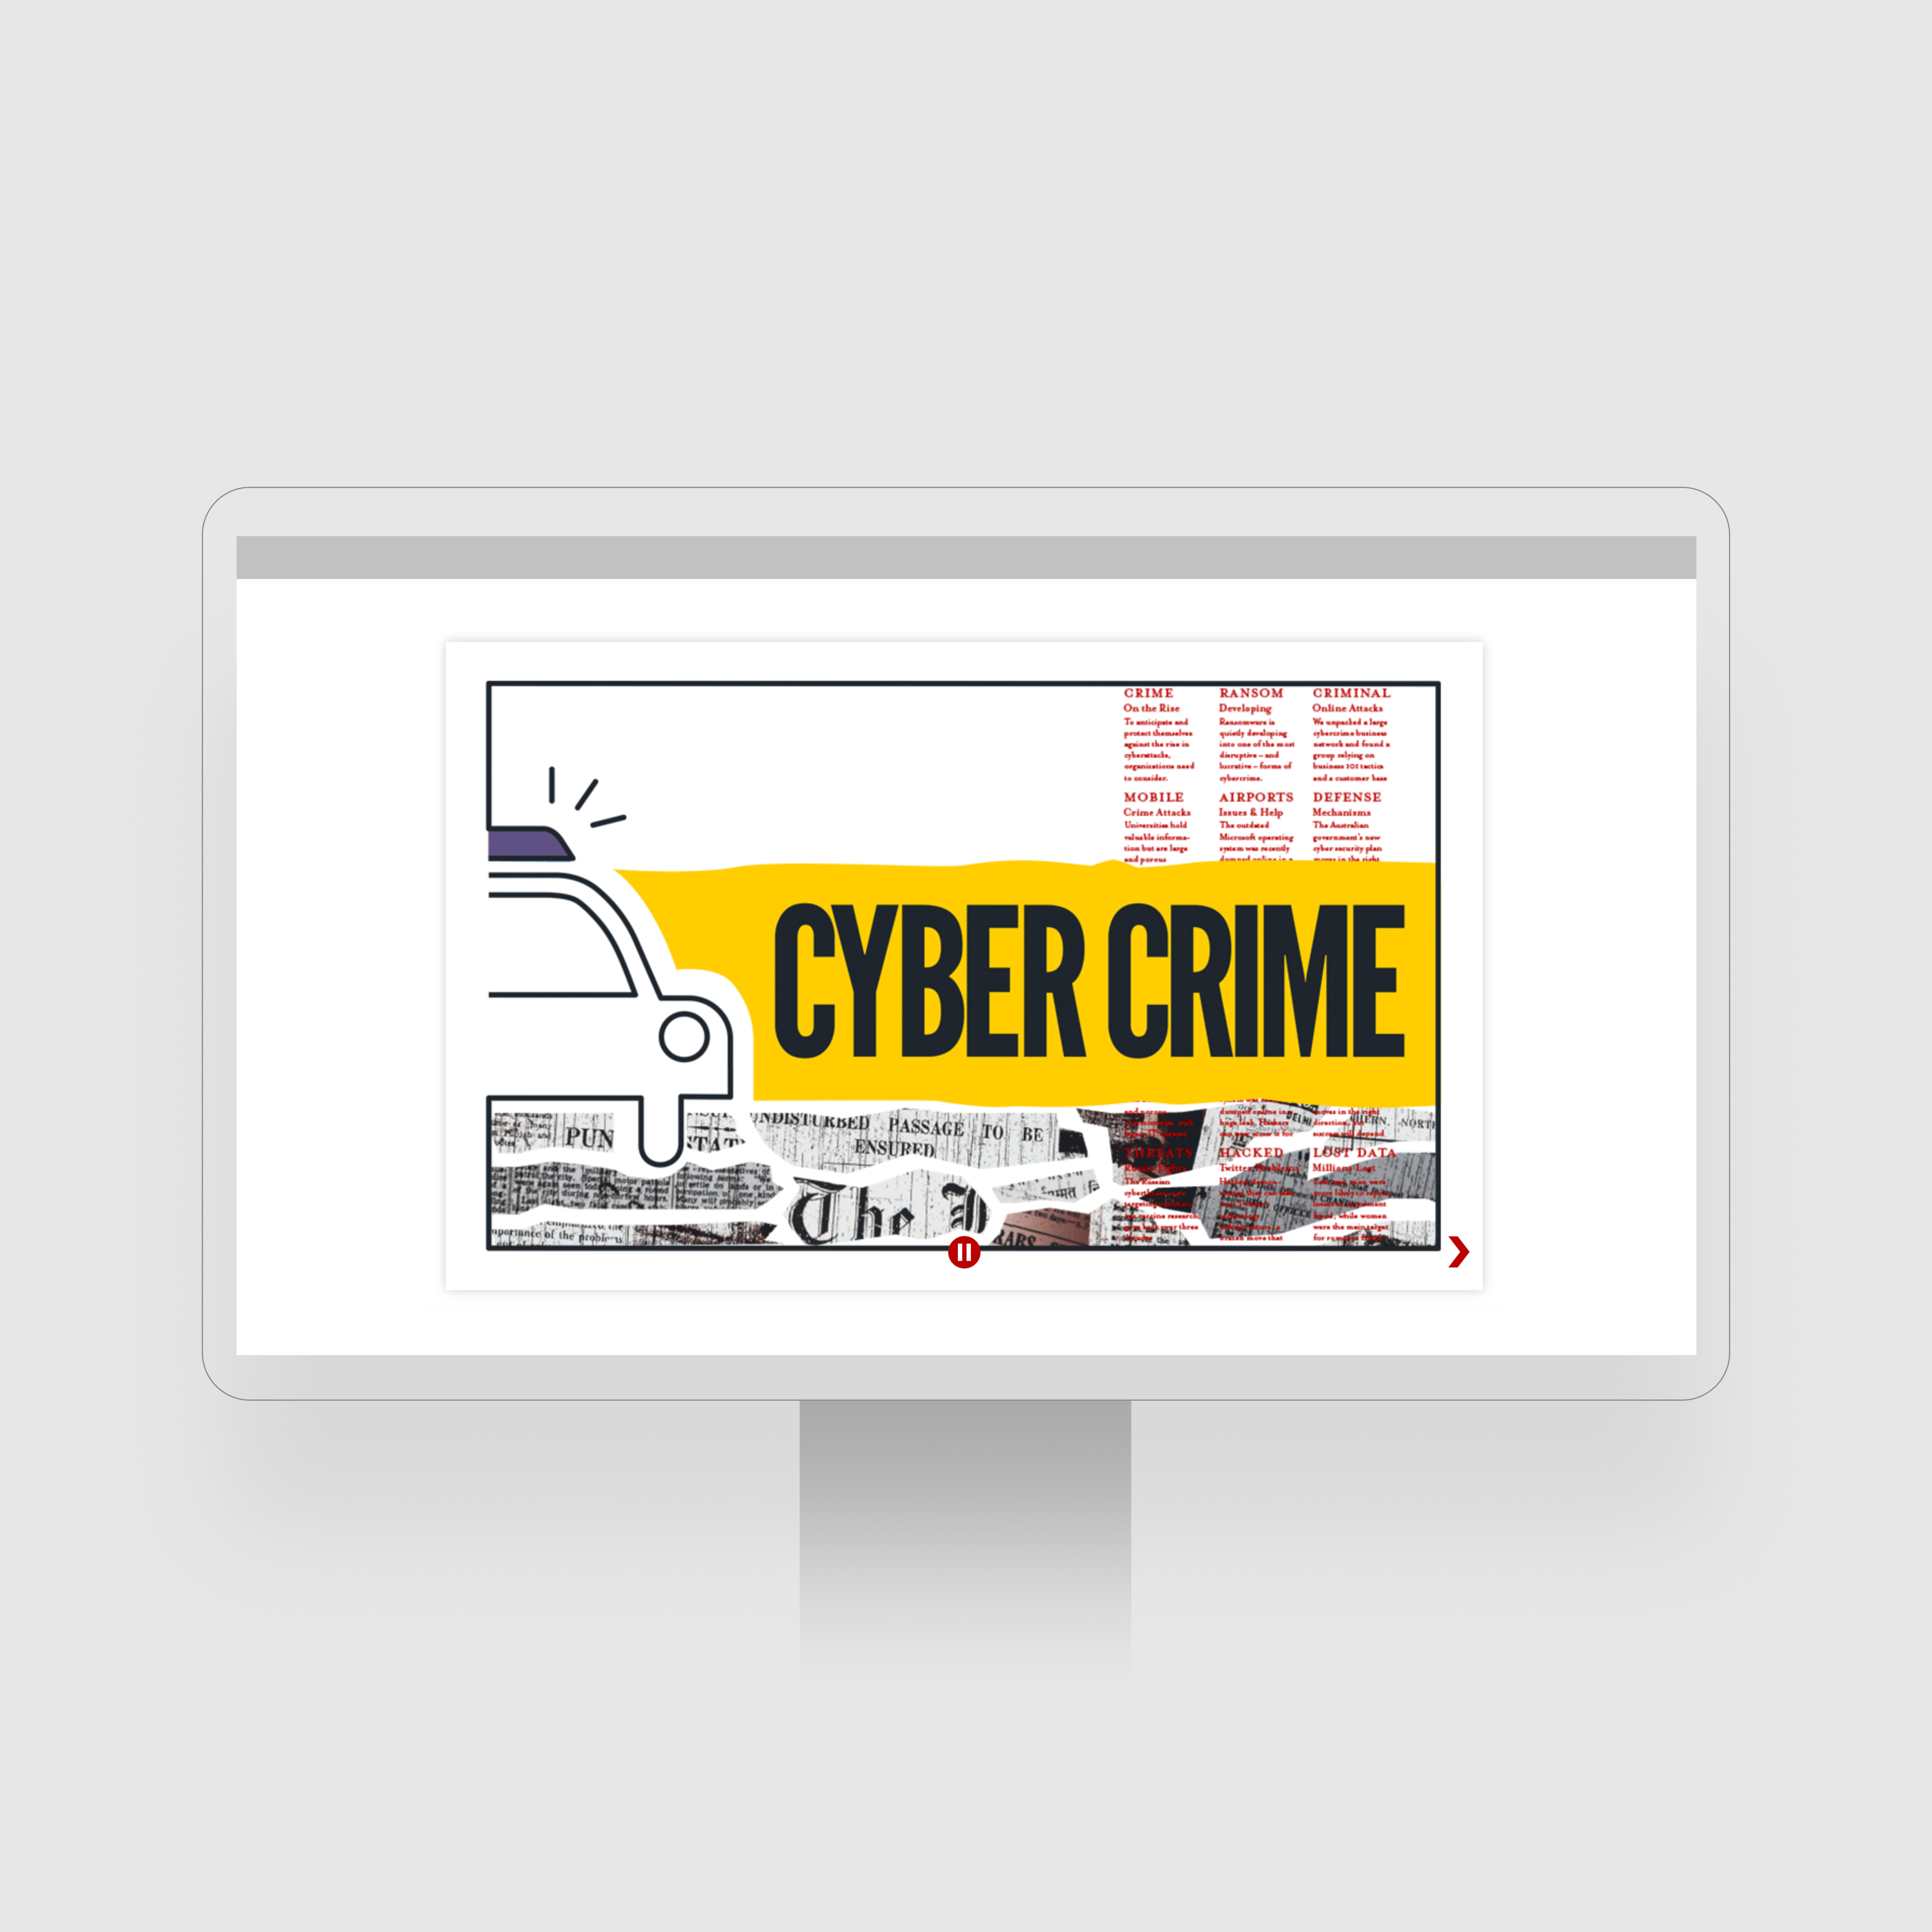

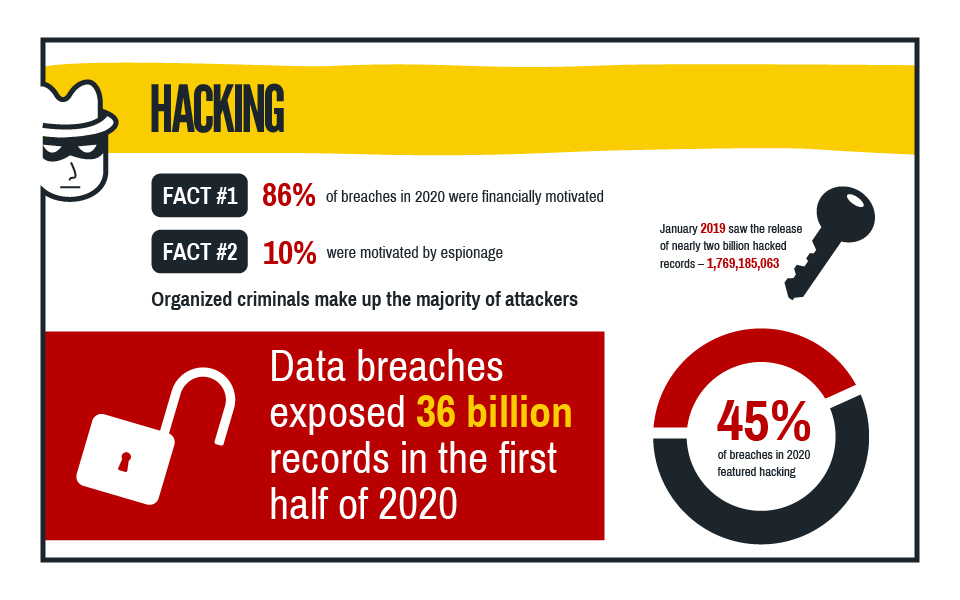
The process for creating this project started with the planning stage. It was the time to think of how I wanted it to look, how I wanted it to feel, and how I was going to get the information across without losing the users interest. Many sketches of different versions and variations were created beforehand. After some decision making and pulling elements from one design to another, it was time to start creating the designs in Adobe Illustrator. Designing the infographic screens took the longest amount of time throughout the project process. It is very important to me to get every small detail right in the designing stage because that stage itself can be a full project. It is imperative that the spacing and alignment is correct, but also that the balance and contrast connects with one another. Everything needs to be different, but feel like it is a part of the same project overall as well.Another big part of this project was the icons and other illustrated elements.
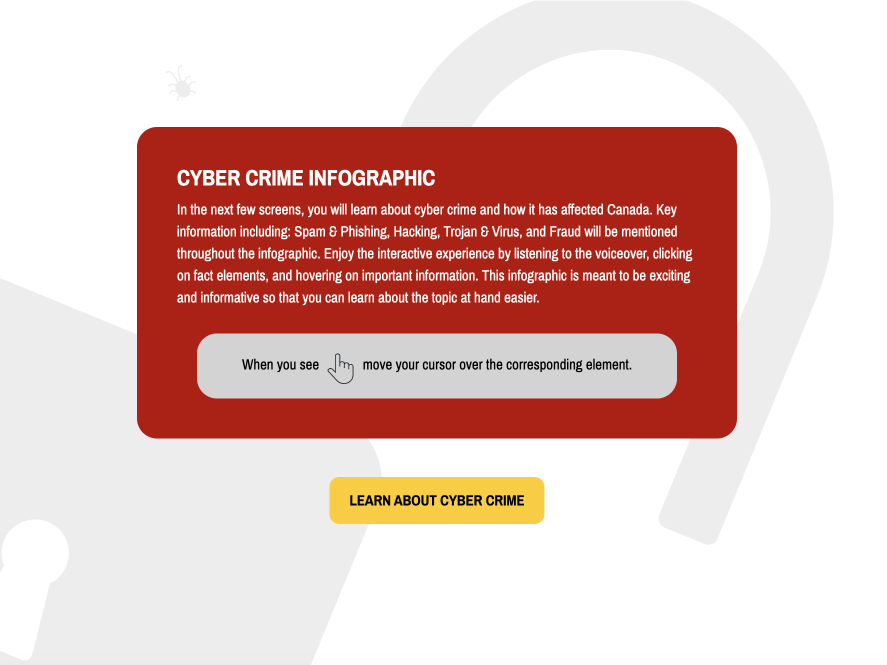
Most of the infographic relied on great elements to support the information. After a few consults and tweaking the design elements, it was time to start implementing the design into a framework. There were certain features that were absolutely needed for the infographic to be successful. A description and instruction section on the first screen was added to help with the user experience, following is a button to start the infographic experience. After adding in the design elements and illustrations, I added smooth transitions and easy navigation. The audio clips were added and I followed the voiceover to create a build with the screen elements. The elements were animated in ways that enhance the user experience throughout. These features include: looping animations, user interactivity, and hover features. Everything done for this project such as the design, coding, and audio were very big parts in making it a success.


My task was to create the design of the project including all of the elements. Designs and elements were made for all six screens including the intro and the reference screen. The preloader, begin button, screens, elements, navigation, and transitions was to be completed as part two of the project. As part three of the project, interface animation, screen content build, screen interactivity, looping animations, and audio was to be completed. This completed version of the Cyber Crime infographic was made within a limited timeframe and exemplifies a successful, exciting, informative interactive motion graphic.
VIEW PROJECT